Maths - Line Graphs
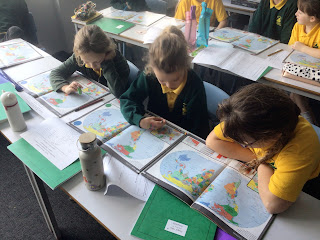
In maths this week, Year 4 have been exploring graphs. Today we were looking at line graphs and comparing these with bar graphs. We discovered that line graphs are used to measure changes over time. To help us to see this further we did an experiment in the classroom to measure number of hops in a minute. We had lots of fun recording our data and drawing the corresponding graphs.


Comments
Post a Comment